Understanding Prometheus and Grafana in DevOps Monitoring
Introduction:
How Prometheus and Grafana can help in monitoring machines, applications, and containers:
Let's understand the basic concepts of Grafana and Prometheus in this blog you are going to get the full conceptual knowledge of Prometheus and Grafana.
So, in terms of DevOps, there are a lot of things that we have to monitor. There could be different applications or services that you want to monitor, or you might be deploying your services or applications and then you also need to monitor the machines or the cluster in which it is running. So, continuous monitoring is one of the important best practices in DevOps, and in that, a lot of tools have been available in the market. So, from that way, considering all the tools moving towards the cloud, Prometheus is one of the popular tools that you would be hearing about. So, that way, in this article we'll just try to understand how we set up Prometheus and how we set up Grafana. Why do we need these two tools, using Prometheus and Grafana, let's see how we monitor a machine or an application, or even you can also monitor your container or your Kubernetes cluster.
Why continuous monitoring is crucial in DevOps:
In modern DevOps practices, continuous monitoring is crucial to ensure that all the machines, applications, and containers used in the development, testing, and deployment processes are running smoothly. In addition to monitoring the machines, we also need to monitor various types of applications like databases, messaging services, log management tools, application servers, and automation tools to ensure their proper functioning.
Challenges in monitoring containers and Kubernetes clusters
Containers have become increasingly popular as they simplify operational activities by allowing us to create a container using a Docker image instead of installing and configuring an application. To monitor containers, we need to ensure that they are running fine and monitor the resources they are utilizing. Since containers are usually deployed in a cluster of machines, we need to orchestrate and monitor the containers using tools like Kubernetes.
To monitor a Kubernetes cluster, we need to track the number of pods running, their resource usage, and the worker machines' health. Instead of using different monitoring tools for each application or container, we can use modern tools like Prometheus to monitor all of them together. In summary, continuous monitoring is a critical aspect of DevOps practices, and we need to monitor machines, applications, and containers to ensure their proper functioning.
Prometheus: A Cloud-Native Monitoring Solution
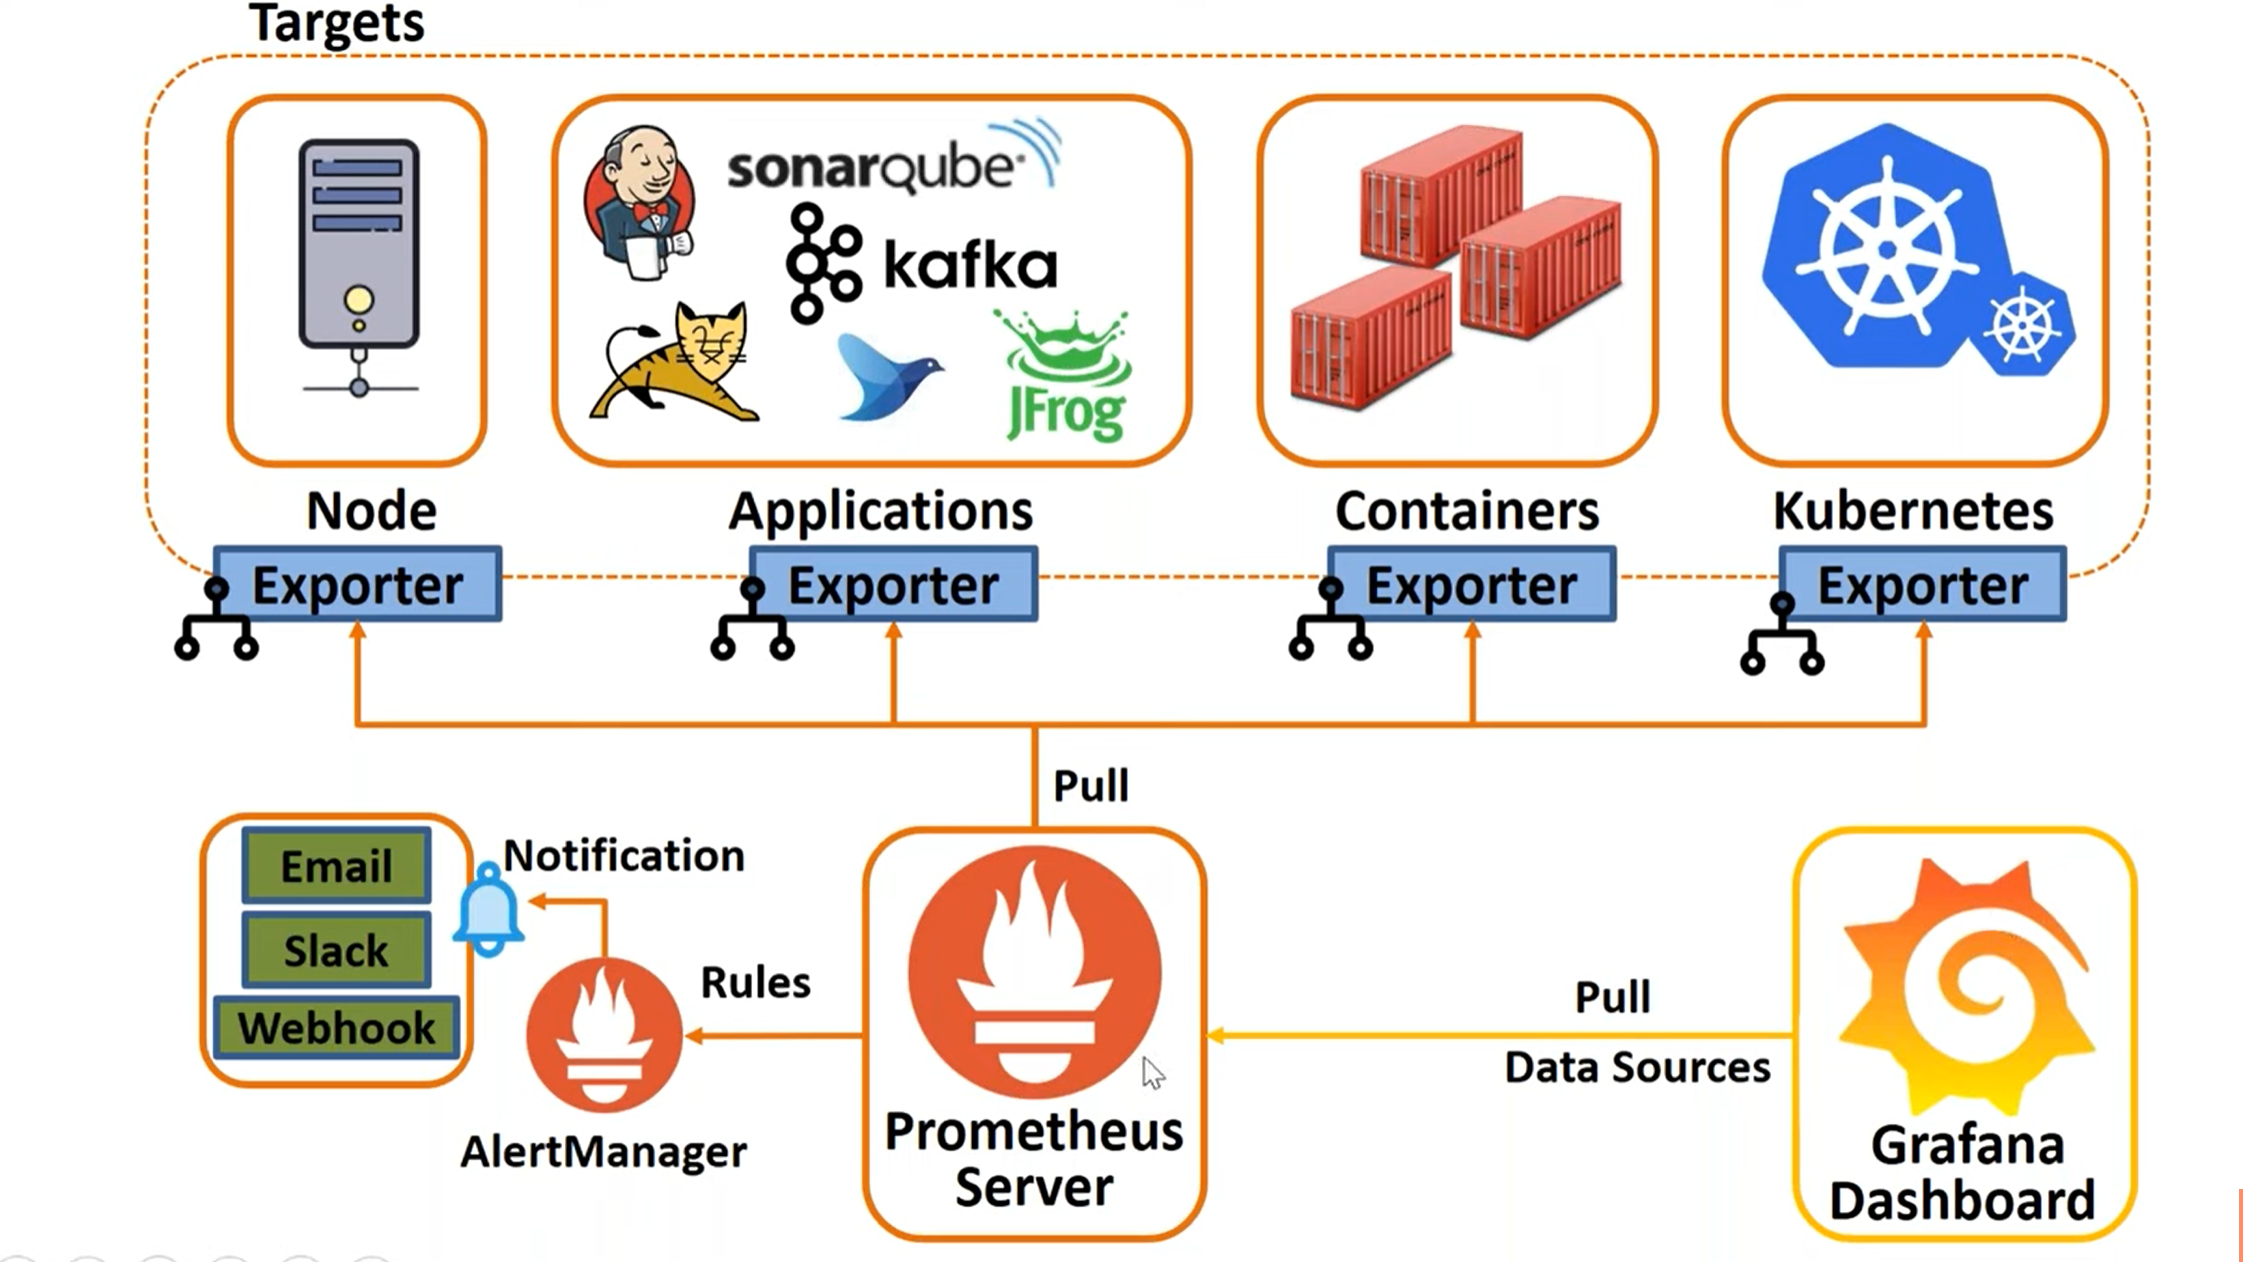
Prometheus is an open-source monitoring tool created under the Cloud Native Computing Foundation (CNCF) that supports and maintains cloud-native tools. It is widely used to monitor any application, machine, or container in a cloud environment. Prometheus works by defining an endpoint for each target, which is a URL or port where metrics will be published. It uses a pull mechanism to regularly query the configured endpoints and retrieve metrics, which are then stored in a time-series database.
Data Collection in Prometheus:
Defining Targets and Collecting Metrics
To collect metrics from machines, applications, or Kubernetes clusters, Prometheus uses a plugin or exporter. The exporter is a type of plugin or agent that should be running on each machine or application that Prometheus has to monitor. Once the exporter is running on the machine or application, Prometheus can connect to the specified URL and gather metrics. Prometheus uses a pull mechanism to collect metrics, where it regularly queries the configured endpoints to retrieve metrics.
Time-Series Data and Visualization
The concept of time series in Prometheus refers to the frequent gathering of metrics or information from all the URLs or endpoints specified as targets. Prometheus collects this data at regular intervals, which is then internally stored as time series. This data can be accessed later to analyze the metrics and trends. However, Prometheus does not have built-in dashboards to display the collected data in a visually appealing way. To visualize the data, we need to use a supporting tool called Grafana.
Alerting with Prometheus
Monitoring has two main components: data collection and visualization, and alerting. To achieve alerting in Prometheus, we use a small utility called Alert Manager, which must be configured separately. By defining rules in the Alert Manager utility, we can receive notifications when certain conditions are met.
Configuring Prometheus
There are various ways to set up Prometheus, such as downloading the package directly or using pre-built Docker images. Docker images are often preferred as they make configuration easier. By running a container from a Prometheus or Grafana image, we can have the application up and running within seconds. However, it is important to know how to configure Prometheus to connect to the appropriate targets. Prometheus reads a YAML file called the prometheus.yaml file to specify the targets and frequency of data collection.
Setting Up Prometheus and Grafana:
To set up Prometheus and Grafana, basic knowledge of Docker is required. Start by taking a Docker image that already has Prometheus installed and creating a container from it. This container will contain the Prometheus application running inside it. As we cannot directly inject data into a container, we must create a volume while creating the container. By sharing data between the host machine and the container through this volume, we can access the container data from the host machine and vice versa.
To begin, create a Prometheus. yaml file on the host machine where Prometheus and Grafana will be set up. When creating the container, map this file as a volume so that Prometheus can read it and begin collecting data based on the targets specified in the YAML file. If you want to set up Prometheus and Grafana on an AWS machine, create a new machine in AWS. With this setup, you can collect and visualize time series data efficiently and configure alerts to receive notifications when specific conditions are met.
create an EC2 ubuntu instance in AWS with the name 'myprom' and connect it with the SSH key.
convert it to the root user by following the command
sudo su
now update your system
apt update
install docker by giving the command
apt install -y docker.io
To run Prometheus inside a container and use the Prometheus username, you need to mount a folder from your host machine to the container to share configuration files or targets. However, Prometheus inside the container won't be able to read the files directly because of user permission differences. To solve this problem, you can create a Prometheus user on the host machine and grant the necessary permissions to the relevant file(s) so that the container running as the Prometheus user can access the configuration files after you mount the folder as a volume from the host machine.
Here are the steps:
Create the Prometheus user on the host machine and the necessary directories:
bashCopy codeuseradd -rs /bin/false prometheus
mkdir /etc/prometheus
touch /etc/prometheus/prometheus.yml
mkdir -p /data/prometheus
chown prometheus:prometheus /data/prometheus /etc/prometheus/*
Configure the YAML file /etc/prometheus/prometheus.yml to define the targets that Prometheus will monitor and the frequency at which it will scrape data from those targets. You create a section for each target, where you specify the name of the section, the frequency of the scraping, and the target URL. Here's an example of a YAML file that monitors your own Prometheus server on port 1990. Once you have configured this, you can add more targets for Prometheus to monitor. Finally, you remove all the numbers and modify the YAML file as per your requirements.
yamlCopy codevi /etc/prometheus/prometheus.yml
global:
  scrape_interval: 5s
  evaluation_interval: 1m
scrape_configs:
  - job_name: 'prometheus'
    scrape_interval: 10s
    static_configs:
      - targets: ['localhost:9090']
Start the Prometheus container with the following command:
bashCopy codedocker run --name myprom -d -p 9090:9090 --user 999:999 --net=host -v /etc/prometheus:/etc/prometheus -v /data/prometheus:/data/prometheus prom/prometheus --config.file="/etc/prometheus/prometheus.yml" --storage.tsdb.path="/data/prometheus"
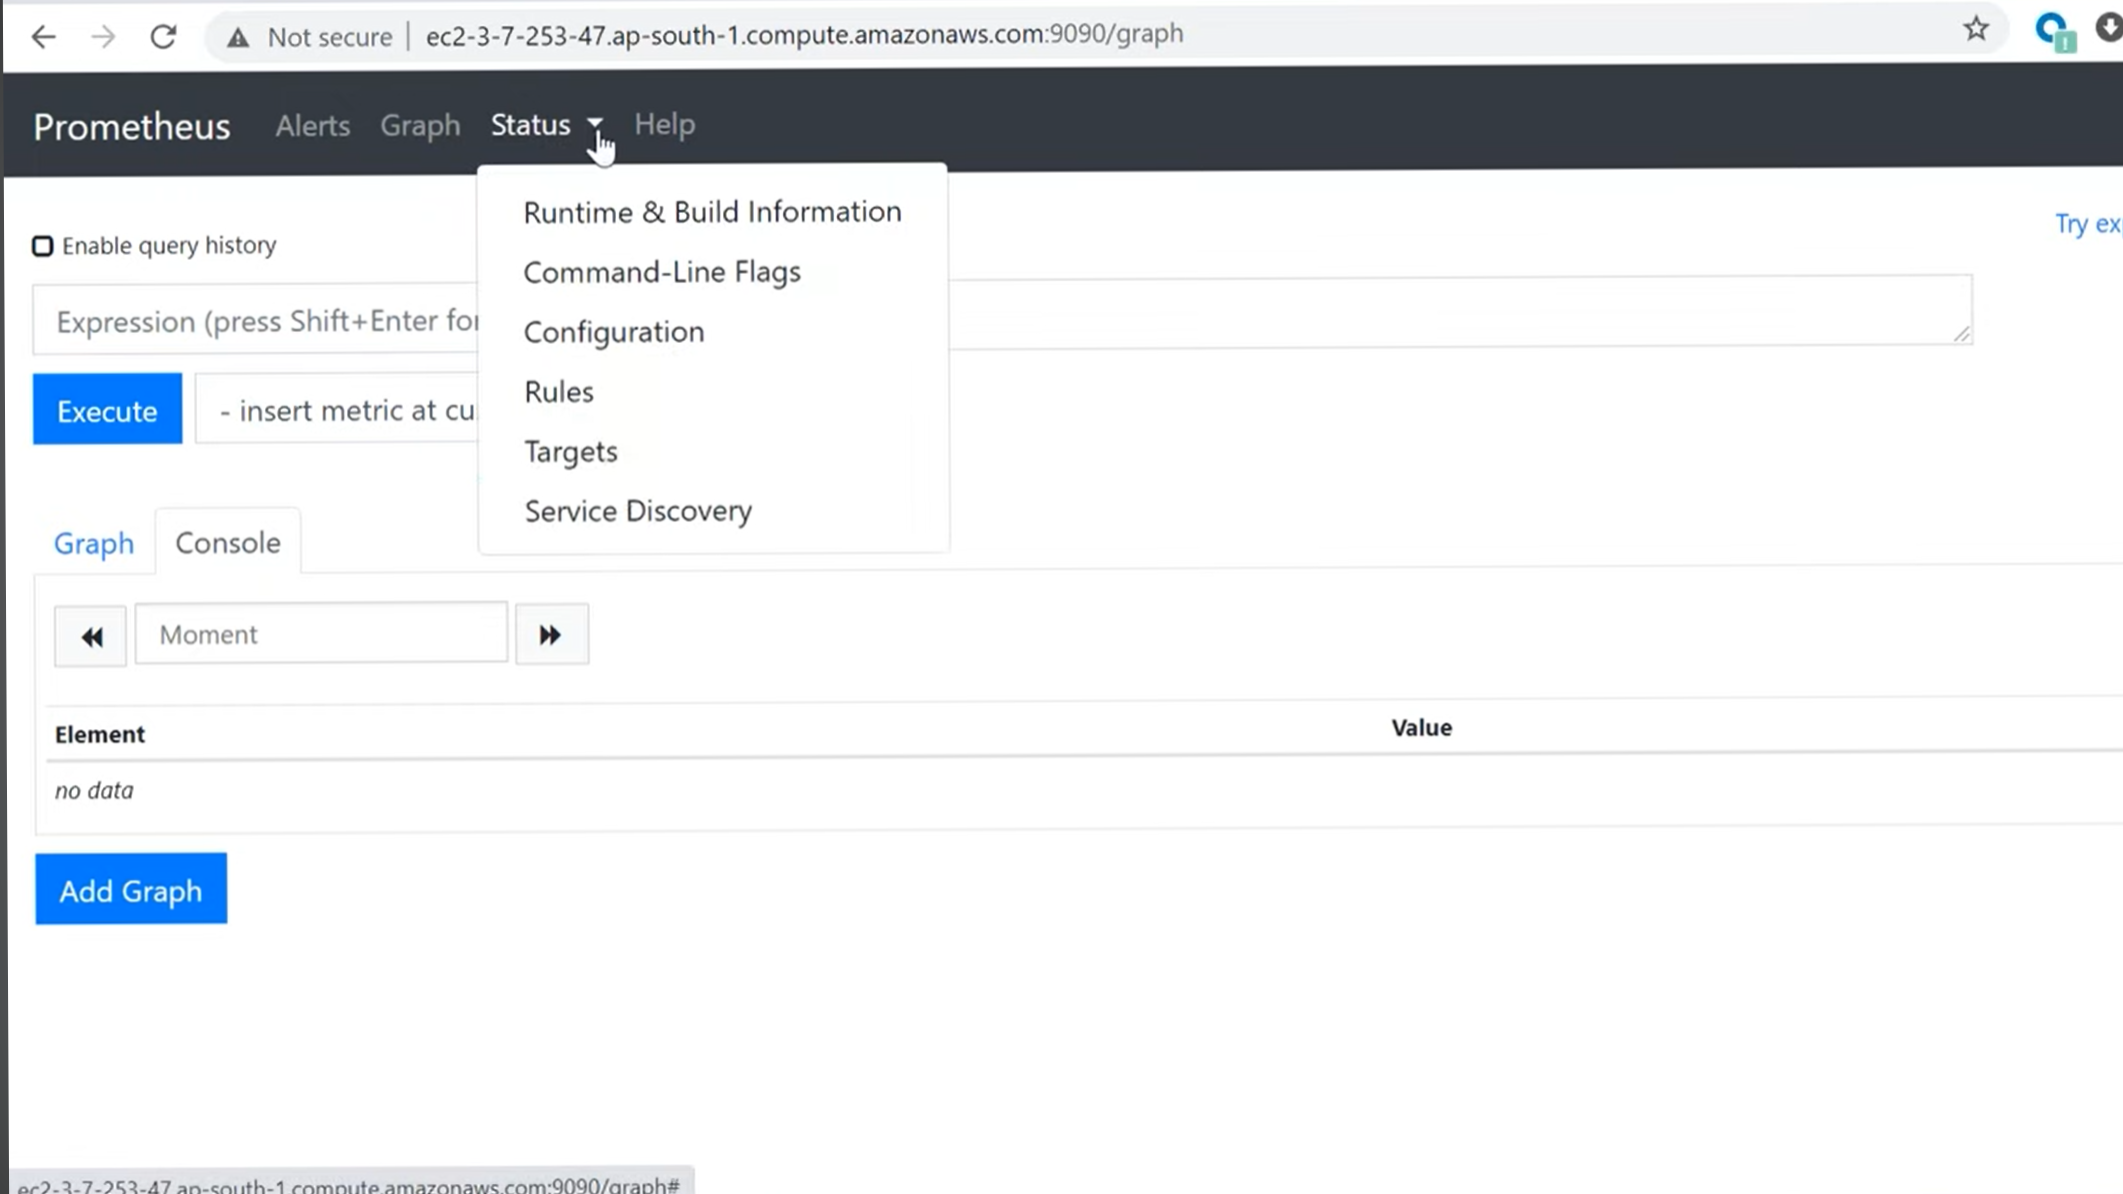
after running the above command get the public IP address of your instance and you get to notice the Prometheus file running in your port
Start the Grafana container with the following command:
cssCopy codedocker run --name grafana -d -p 3000:3000 --net=host grafana/grafana
Check the logs of the Grafana container to make sure it started successfully:
Copy codedocker logs -f grafana

Once you have installed Grafana, the default username and password will be admin. After logging in, you will be prompted to change your password. By default, Grafana has no data source, so we need to connect it to Prometheus, which is the tool that collects metrics. To do this, go to the Grafana homepage and add a data source. There are various types of data sources available, but since we are using Prometheus, select Prometheus from the options. Then, provide the URL of your Prometheus server, which is where Grafana will get its data. In this example, we are using the default localhost:1990. Once you have added and tested your data source, Grafana will be able to display the data that Prometheus has collected.
To see the data in a dashboard, you need to create one. First, update your Prometheus server YAML file to specify which targets it should scrape data from. You need to make sure that the exporter is running and exposing the URL or endpoint that you want to monitor. Then, restart Prometheus so that it can pull the information and store it. Next, in Grafana, create a dashboard and use the data source that you just configured. Grafana will be able to display the data that Prometheus has collected, and you can customize the dashboard to suit your need.
conclusion:
continuous monitoring is an essential practice in DevOps, and Prometheus and Grafana are two popular tools used for monitoring machines, applications, and containers. Prometheus is a cloud-native monitoring solution that collects and stores time-series data, while Grafana provides visualization and dashboarding capabilities. Together, they offer a powerful monitoring and alerting solution for DevOps teams. Setting up Prometheus and Grafana requires basic knowledge of Docker and YAML configuration. By following the steps outlined in this article, one can set up Prometheus and Grafana on a host machine or AWS instance and begin collecting and visualizing time-series data.
I hope you have understood the basic concepts and installation of Grafana and Prometheus feel free to comment if you face any errors.


